Solutions 1: Modelling Tuberculosis in England and Wales
Sam Abbott, Katy Turner
Source:vignettes/solutions-one.Rmd
solutions-one.RmdThe models outlined below are possible solutions to practical 1. However, the construction of dynamic models needs to consider the study question which they will be used to answer and because of this there is no single correct model for any given disease. Possible modelling questions are,
- A new point of care test for TB has been developed. This test can detect resistance to all first line TB treatments with 100% sensitivity (true positive rate) and 50% specificity (true negative rate). What impact will this have on TB incidence?
- There has been a prolonged shortage of the BCG vaccine, now that there is plentiful supply should a catch up program be implemented for those that missed vaccination?
- Tuberculosis screening for all new migrants has been proposed as a new method of TB control. Evaluate the impact of this intervention.
Parsimonous Model of Tuberculosis (TB)
The susceptible, exposed (latently infected), infectious and recovered (SEIR) model of TB is the simplest model that can be constructed which still reflects the known dynamics of TB[1]. As TB has a long latent period, with cases potentially remaining infected but not actively symptomatic for many years, it is generally necessary to include demographic processes in any model of TB.
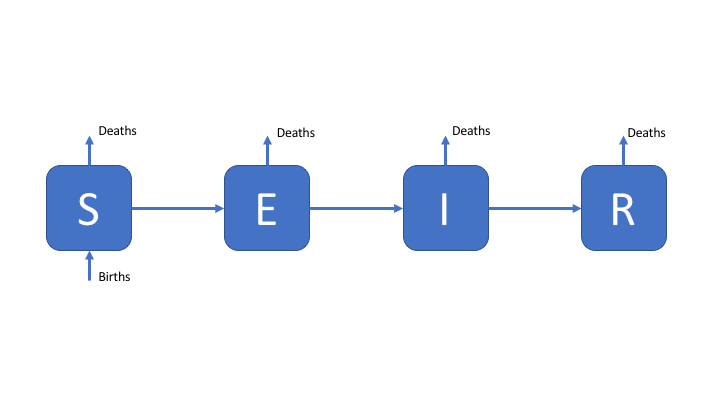
Figure 1: An SEIR model of TB transmission, including simple demographic processes
Towards a More Complex Model of TB
Whilst latency can be simplistically modeled as a single population compartment this does not reflect the varying risk of activation observed in those latently infected. A more realistic modelling approach is to allow for two latent stages, one at high risk of progression to infectious disease, and one at significantly lower risk of progression to active disease. This is commonly modeled as a period of high risk (H) directly after infection (lasting 1-2 years), followed by a longer period of low risk (L). This is represented in the following flow diagram. Reinfection of low risk latent cases is also modeled with the assumption that they reenter the high risk population.
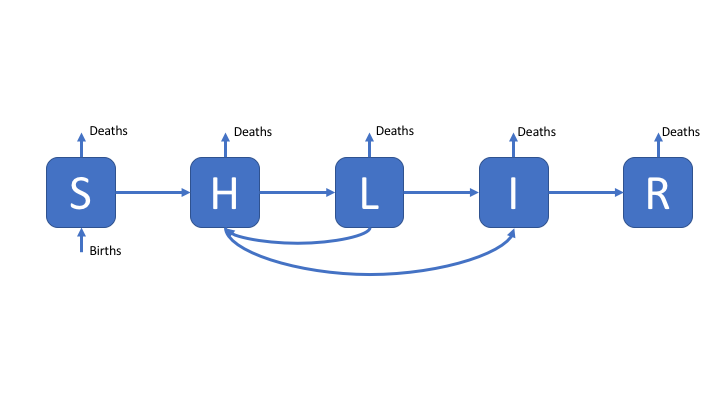
Figure 2: An SHLIR model of TB transmission, including simple demographic processes
A Complex Model of TB
In England and Wales the distribution of TB cases is highly heterogeneous with the majority of cases occurring in the non-UK born, because of this a model which assumes homogeneous mixing may fail to capture the observed dynamics of TB. An approach to resolve this is to include risk structure by stratifying the model into two separate population groups (here UK born and non-UK born). The flow diagram for this model is show below, for simplicity is has been assumed that it is possible to be born into both populations. This model also includes treatment, and reinfection for recovered individuals.
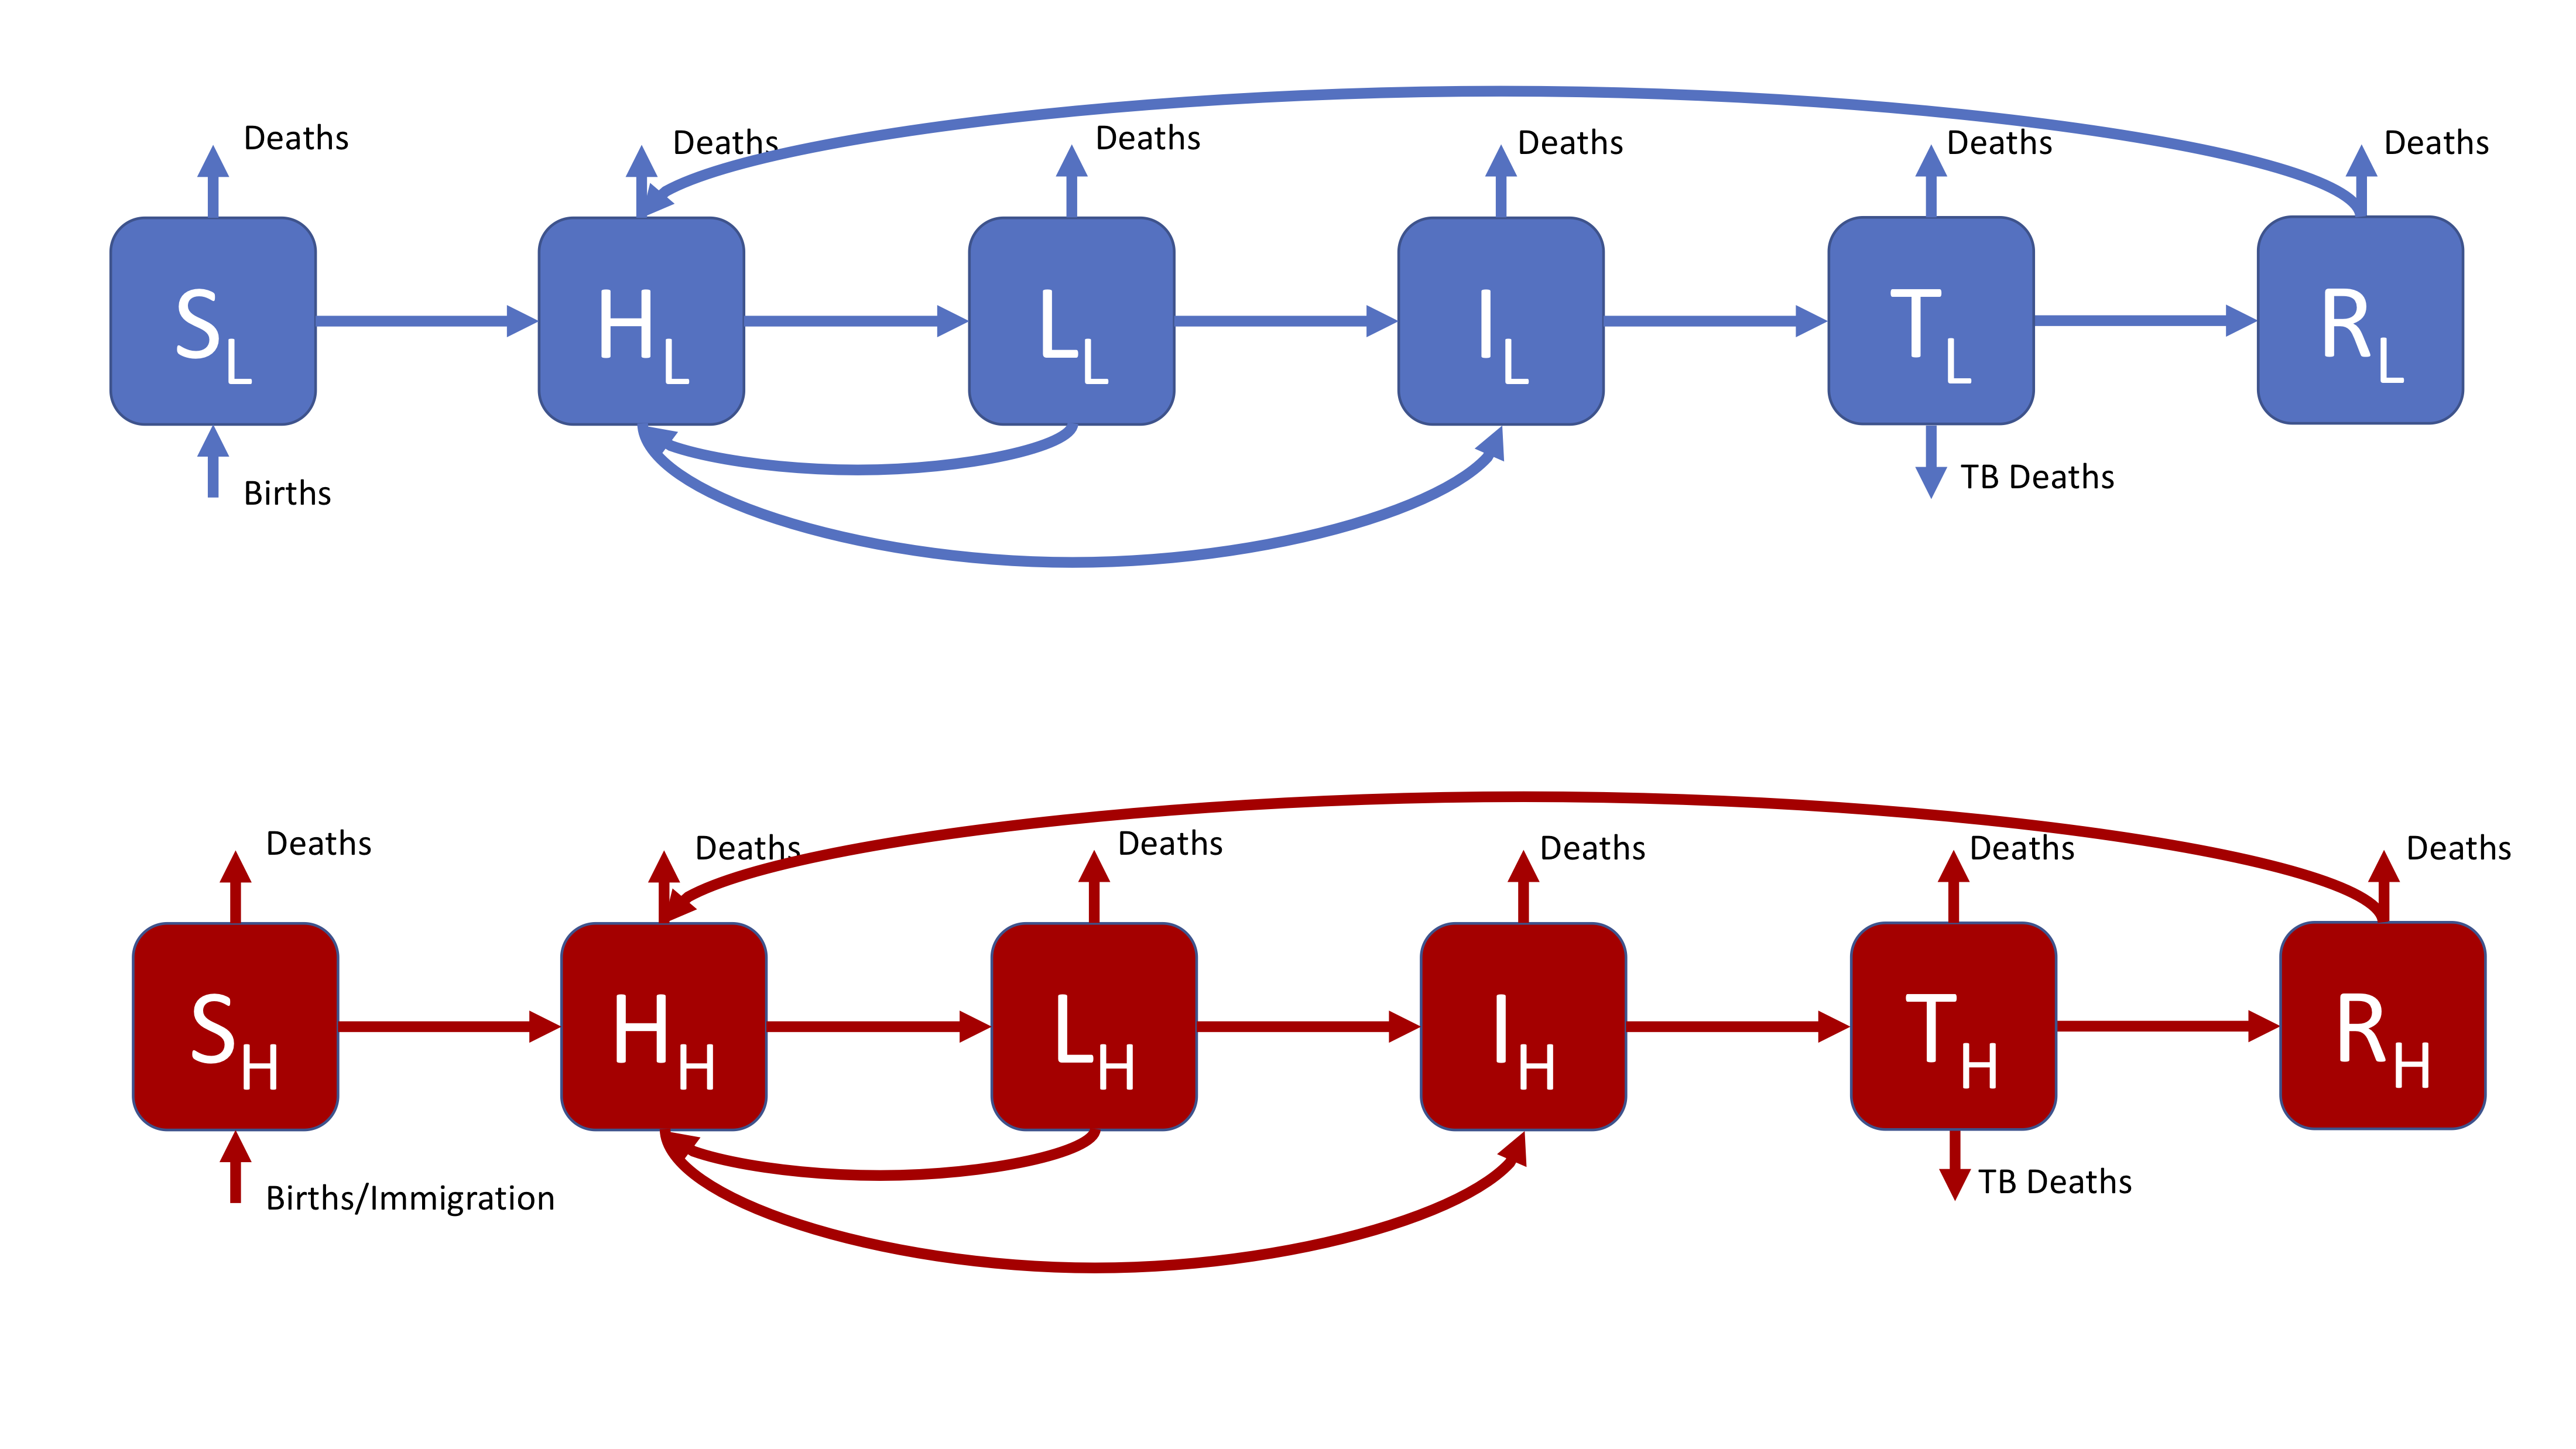
Figure 3: A realistic SHLIR model of TB transmission, including simple demographic processes
Figure 3 does not include the interaction between the high and low risk subgroups as this is through the force of infection. The force of infection is defined as,
\[ \lambda_i = \beta \sum_{j = L, H}M_{ij}I_j \]
Where \(\lambda_i\) is the force of infection in each risk group (\(i = L, H\)) and \(M_{LH}\) is the mixing rate between risk groups. It may be assumed that within group contact rates are equivalent and defined such that,
\[ M_{ii} = 1 \]
Data or expert knowledge is then required to parameterise the between group mixing (\(M_{ij}\), where \(i \neq j\)).
References
1 Brooks-Pollock E, Cohen T, Murray M. The impact of realistic age structure in simple models of tuberculosis transmission. PLoS One 2010;5:3–8. doi:10.1371/journal.pone.0008479