Practical 1: Modelling Tuberculosis in England and Wales
Sam Abbott, Katy Turner
Source:vignettes/practical-one.Rmd
practical-one.RmdLearning Objectives
- Understand how to develop a simple Tuberculosis model flow diagram.
- Be aware that models should be parsimonious, with as few parameters as possible to capture the dynamics of interest.
- Understand that model structure may be subjective, and that there can be many approaches to answering a given question.
Outline for Session
- Get into groups of 4-6 (2 minutes)
- Read through the exercise (5 minutes)
- Briefly summarise key TB facts (10 minutes)
- Discuss model structure (15 minutes)
- Finalise model structure (5 minutes)
- Return for whole group discussion (2 minutes)
- Discuss possible model structures and how these may be altered to answer study questions (20 minutes)
Exercise
Develop a flow diagram for a model of Tuberculosis (TB) transmission in England and Wales. In your groups read through the TB summary below, discuss a model structure for the transmission of TB, and then draw your model as a flow diagram.
Remember that your model should aim to be as parsimonious as possible and therefore should not try to capture the full complexity of TB transmission in the UK. For more information about TB see the accompanying fact sheet. For some ideas about what previous models have included see the hints section below.
TB summary
- Both a respiratory (pulmonary) and non-respiratory (extra-pulmonary) disease, with respiratory cases accounting for the vast majority of transmission.
- After infection individuals enter a latent stage, where they initially have a high risk of developing active disease. After 1-2 years the risk of activation greatly diminishes.
- Infectiousness, mortality and likelihood of developing various types of TB vary with age.
- The BCG vaccine has been in use for over 50 years, but has not led to the elimination or control of TB due to variable effectiveness (0-80%), a limited period of protection (10-15 years) and not acting to prevent initial infection.
- Multiple antibiotics are used to treat active TB, mostly developed between the 1950s-1980s. Many of these have severe side effects and must be taken daily for at least 6 months.
- England and Wales are low incidence countries, with the majority of cases occurring in the non-UK born.
- Diabetes, smoking, homelessness, recent incarceration and low socioeconomic status are all key risk factors.
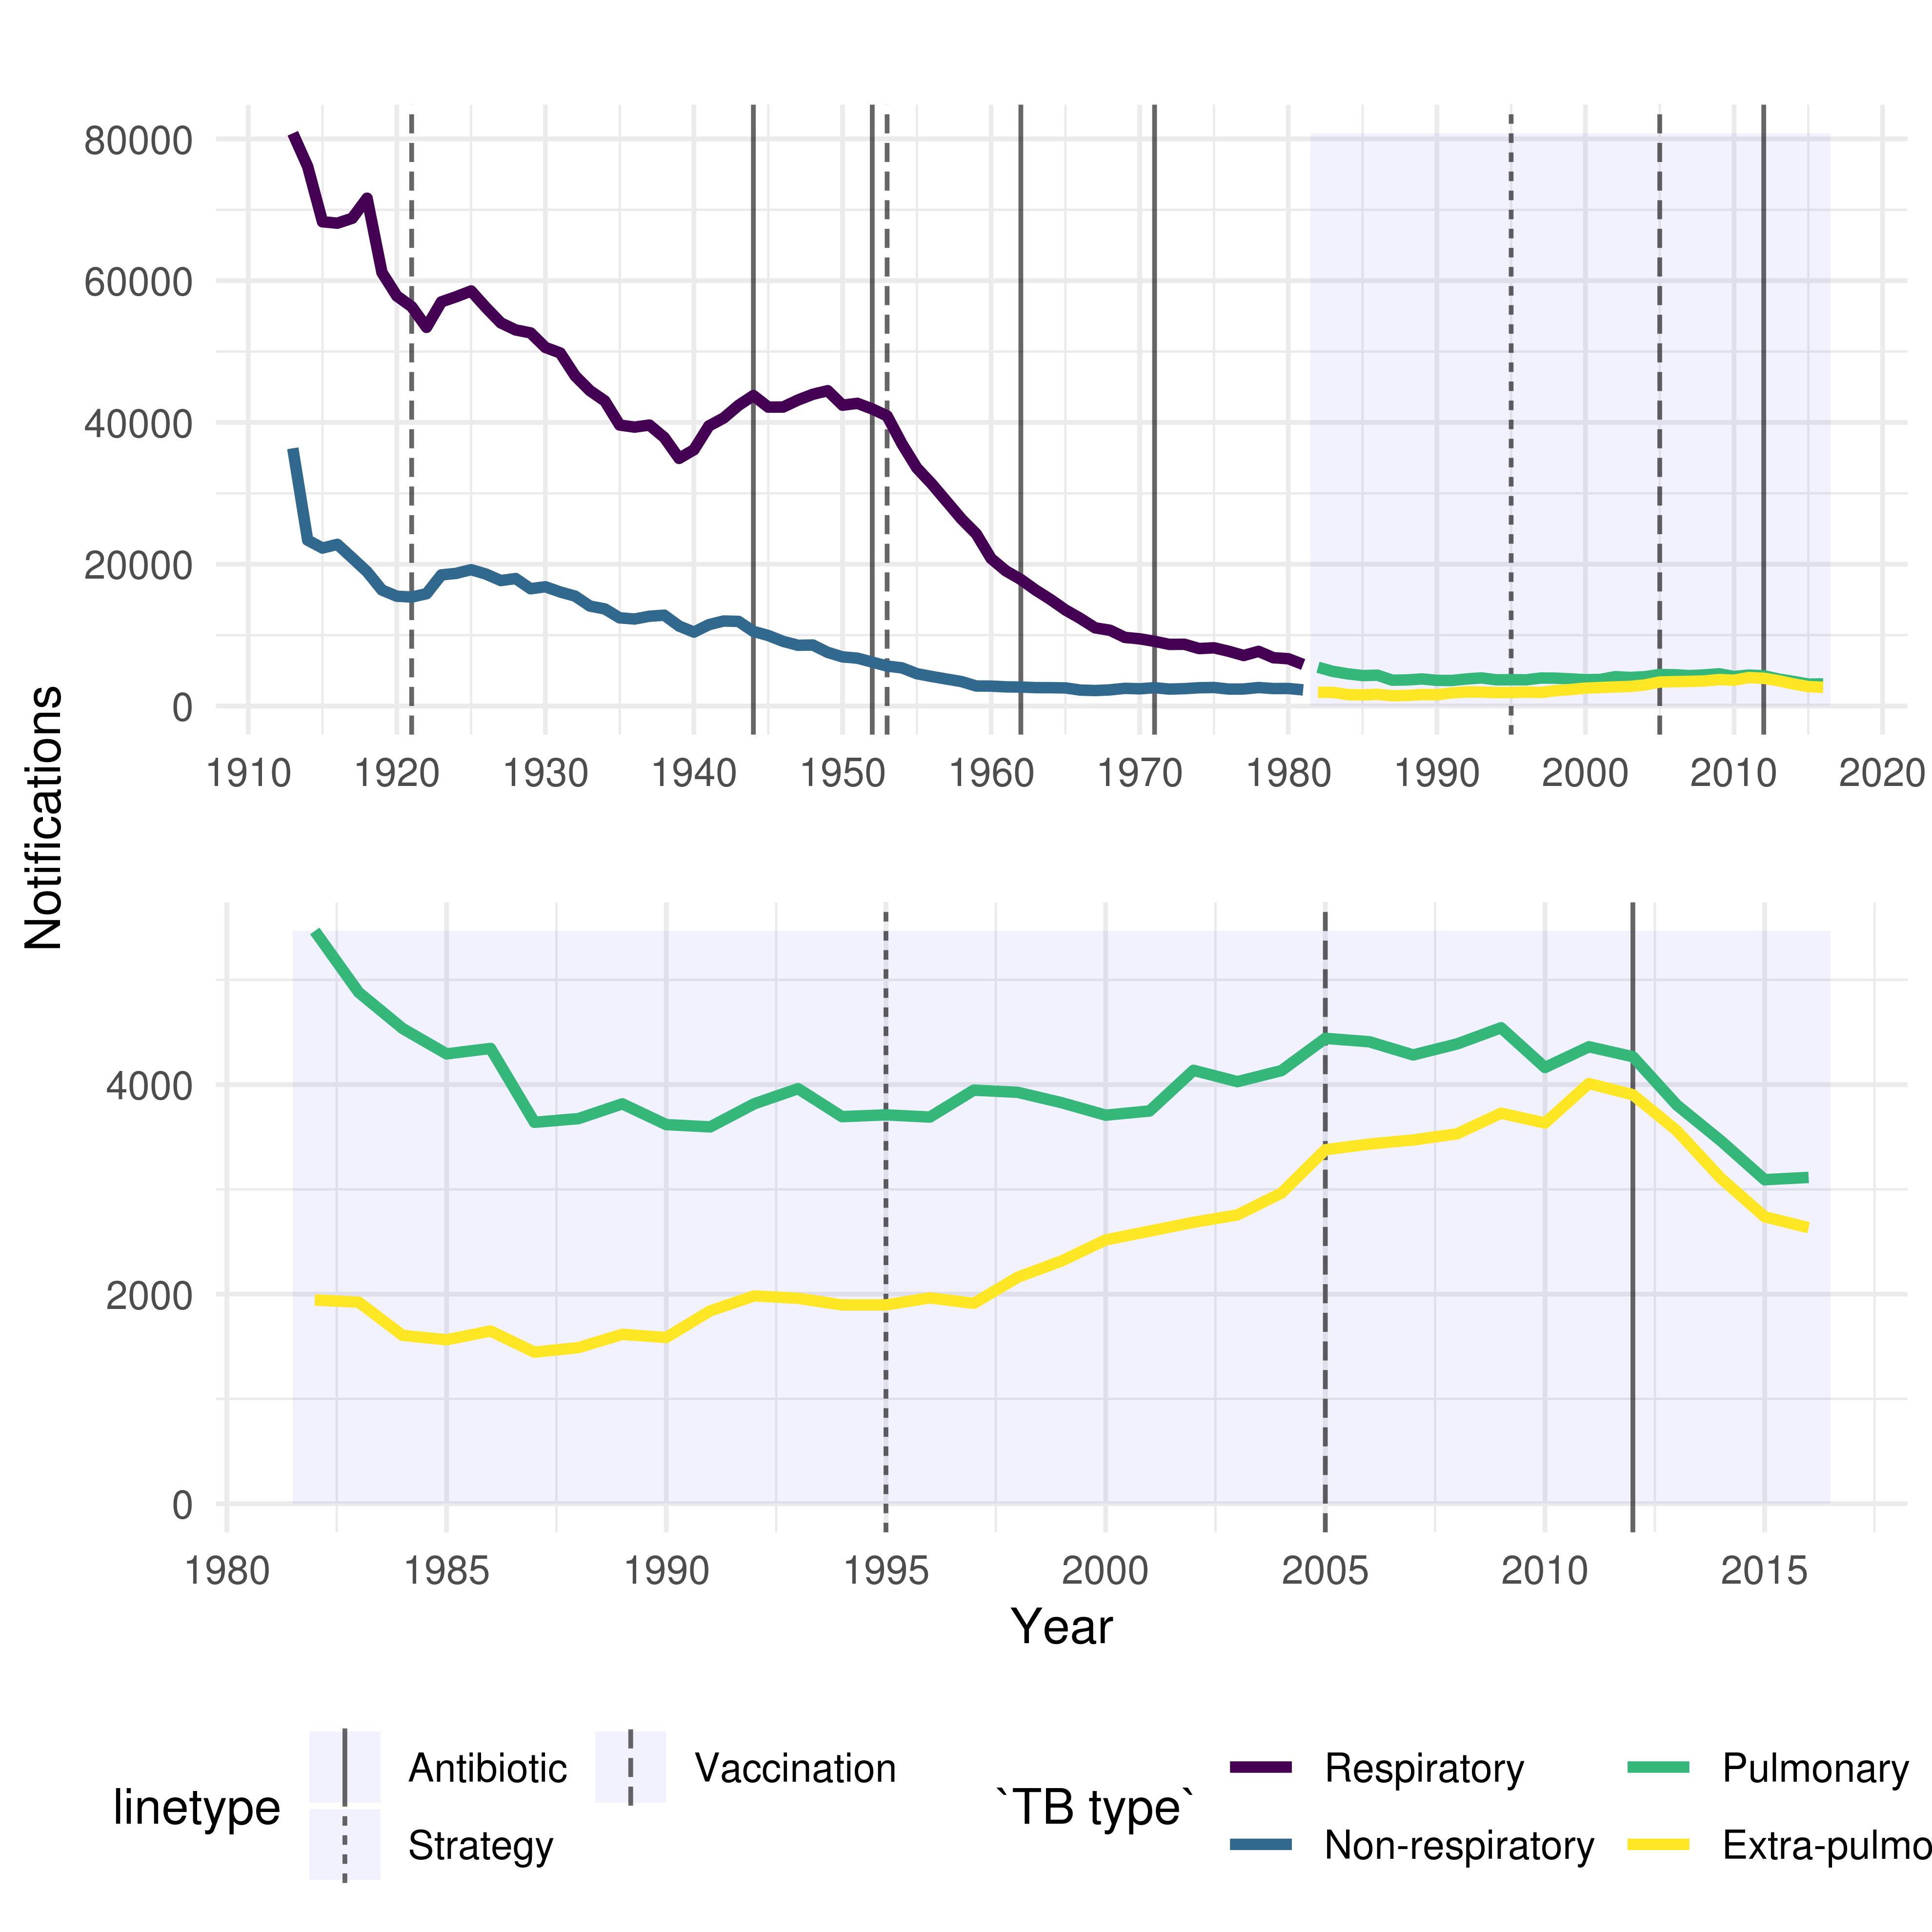
- Incidence rates in the UK born have been stable for the last two decades with little evidence of decline. See Figure 1, or http://www.seabbs.co.uk/shiny/TB_England_Wales for an interactive dashboard.

Figure 1: TB notifications in England and Wales from 1913 to 2016, stratified initially by respiratory/non-respiratory status and from 1982 by pulmonary/non-pulmonary TB. Interventions are highlighted with vertical lines, with linetype denoting the type of intervention.
Hints
There are several components that are often included in models of TB, these are:
- Demographic processes such as natural mortality and birth.
- Multiple latent stages prior to active disease, with each having a different activation rate.
- Reinfection for those previously latently infected or who have recovered from active disease.
- Reactivation for individuals who have recovered from active disease.
- Mortality due to TB.
- Case importation from high burden areas.
- Drug resistance which can either develop from failed treatment or infection with a drug resistant strain of TB.
- High and low risk population groups.
- Age structure.